Analytics Dashboard
The Analytics of Document-Copilot provides comprehensive insights into your document and chat usage. It is divided into four sections to help you track performance, manage storage, and optimize your interactions.
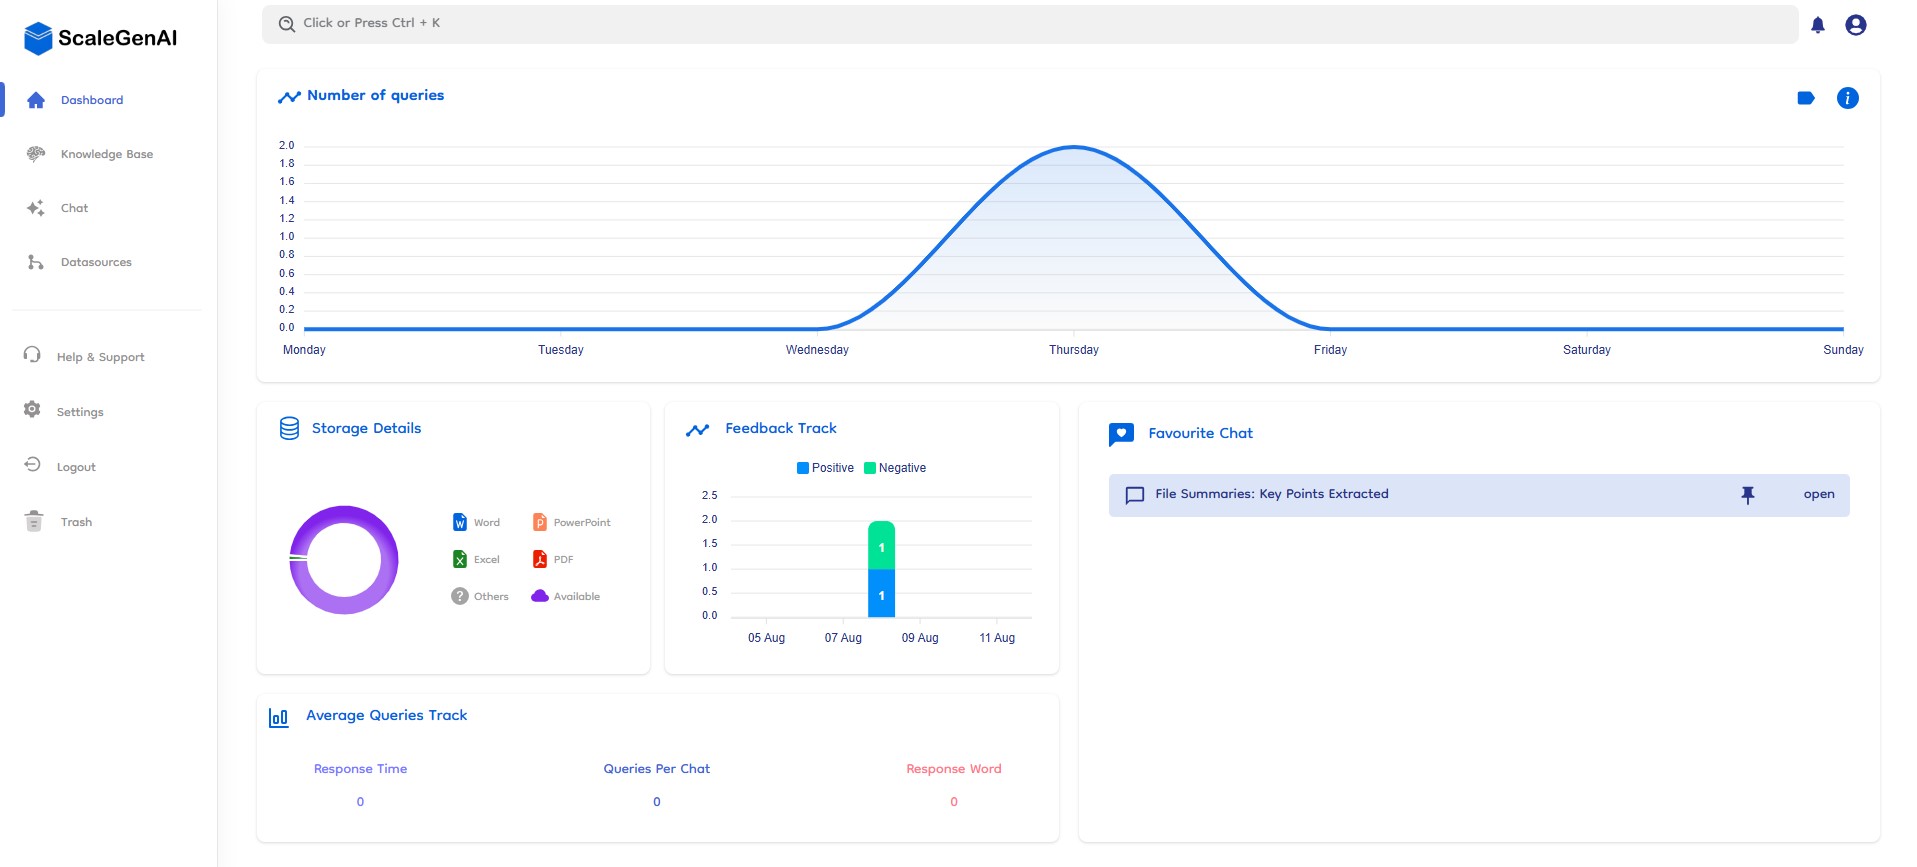
📈 Number of Queries
Weekly Analytics Graph
- Visual Insights: A dynamic graph displaying the number of queries made each week.
- Trend Analysis: Easily identify trends and patterns in query volume over time.
- Performance Tracking: Monitor the efficiency and usage of your documents through query analysis.
⭐ Favourite Chat
Top Engaged Chats(Pinned Chats)
- Highlight Key Discussions: Identify and prioritize your most engaged and valuable chats.
- Important Chat: Pinned important chat will be tracked from here.
- Optimize Interaction: Use insights to enhance communication and collaboration within your team.
📊 Storage Detail
Detailed Breakdown
- Usage Overview: Get a clear overview of your storage usage with a detailed breakdown.
- Category Insights: See how much storage is taken up by different file types (PDF, Excel, Docs, Others).
- Percentage Breakdown: Visual representation of storage distribution by percentage.
Storage Details:
- Available: XX%
- PDF: XX%
- Excel: XX%
- Docs: XX%
- Others: XX%
💹 Chat Feedback Track
Key features
- Visual Feedback Overview: Displays a bar chart showing the number of positive and negative ratings users give to AI responses.
- Weekly Analysis: Graphs feedback counts by date to track user sentiment over a week.
- Interactive Elements: Allows users to filter and view feedback data, all positive or negative response data.
- Real-Time Updates: Dashboard updates in real-time or at regular intervals to reflect the latest feedback data.
📉 Average Track
Key Performance Metrics
- Response Time: Monitor the average response time to queries, ensuring quick and efficient communication.
- Queries Per Chat: Track the average number of queries per chat to understand engagement levels.
- Response Word Count: Analyze the average word count per response to gauge the depth of interactions.
Average Metrics:
- Response Time: XX minutes
- Queries Per Chat: XX
- Response Word Count: XX words